Navigation auf uzh.ch
Navigation auf uzh.ch
The Italian sculptor Mauro Staccioli (1937–2018) left behind an extensive body of artworks and archive material. He is particularly known for his “sculpture-interventions” – large constructions that are embedded in various surroundings and critically reflect them.
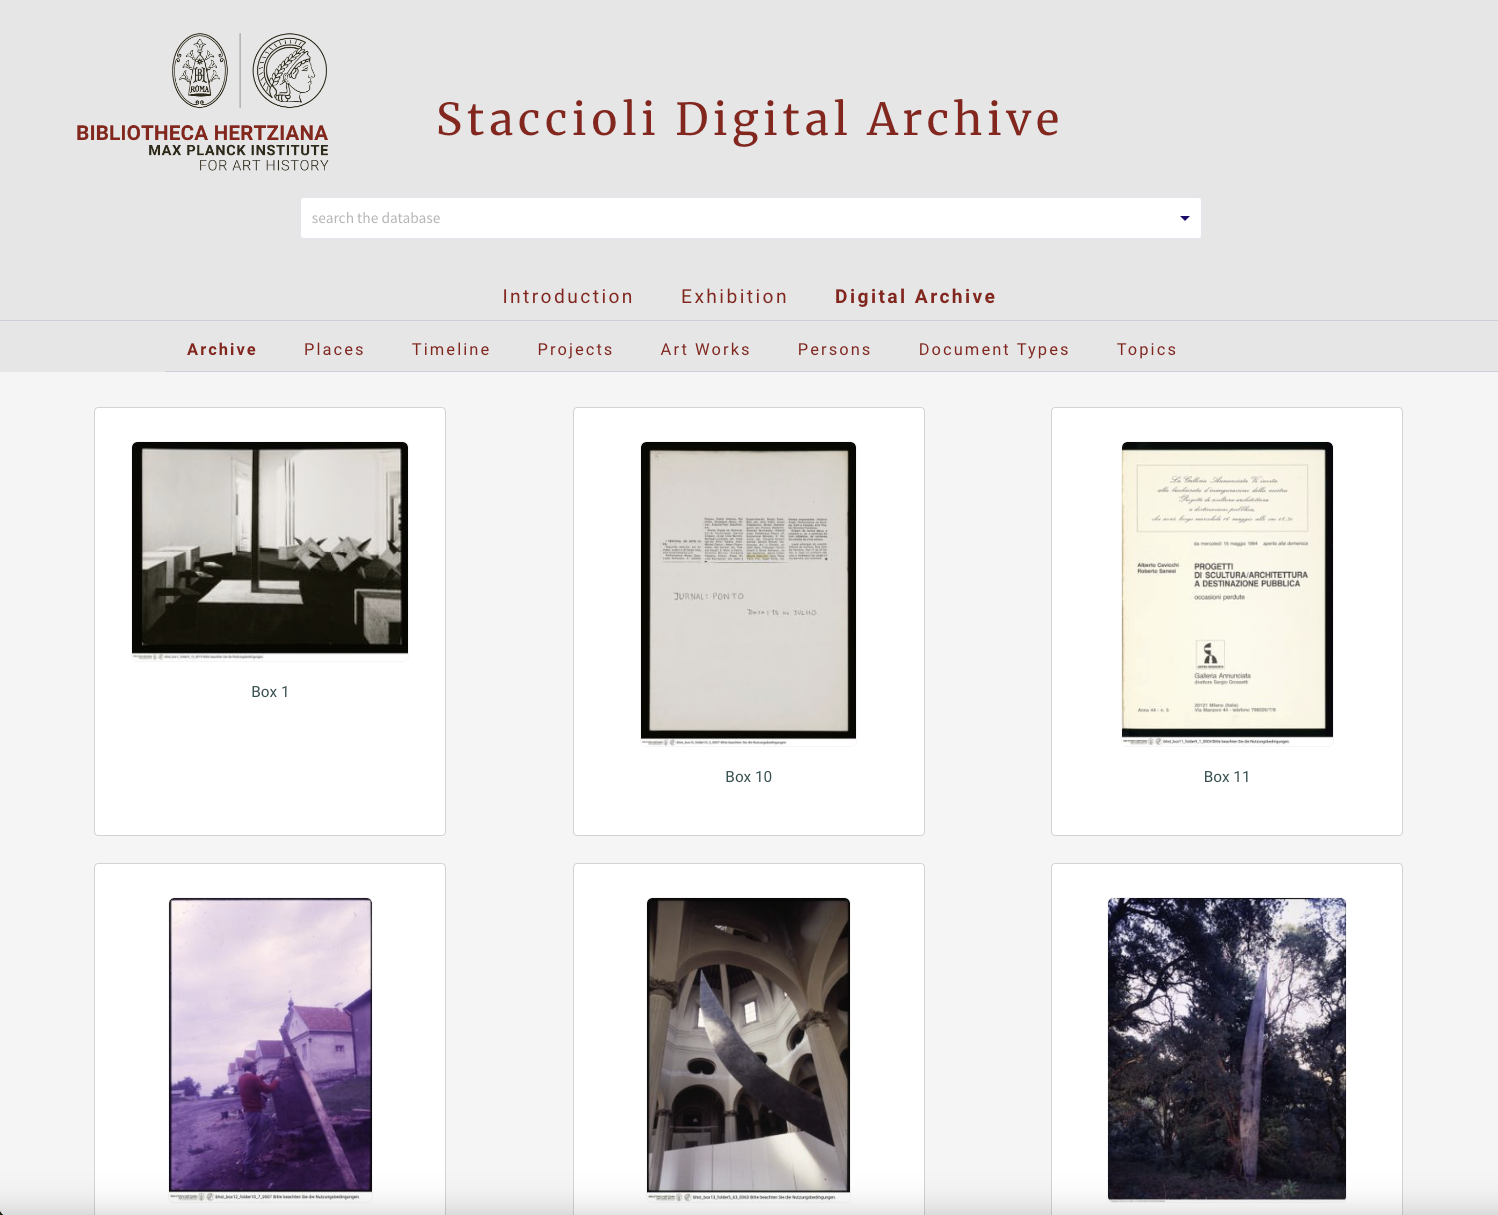
Staccioli's estate has been digitised and made accessible via the Staccioli Digital Archive. The project was initiated by the Bilbliotheca Hertziana of the Max Planck Institute in Rome, whose Photographic Collection and Digital Humanities Lab were involved in its realisation. The Staccioli Digital Archive is based on a version of ResearchSpace that was adapted by the Swiss Art Research Infrastructure (SARI) and expanded to include an interactive network visualisation.
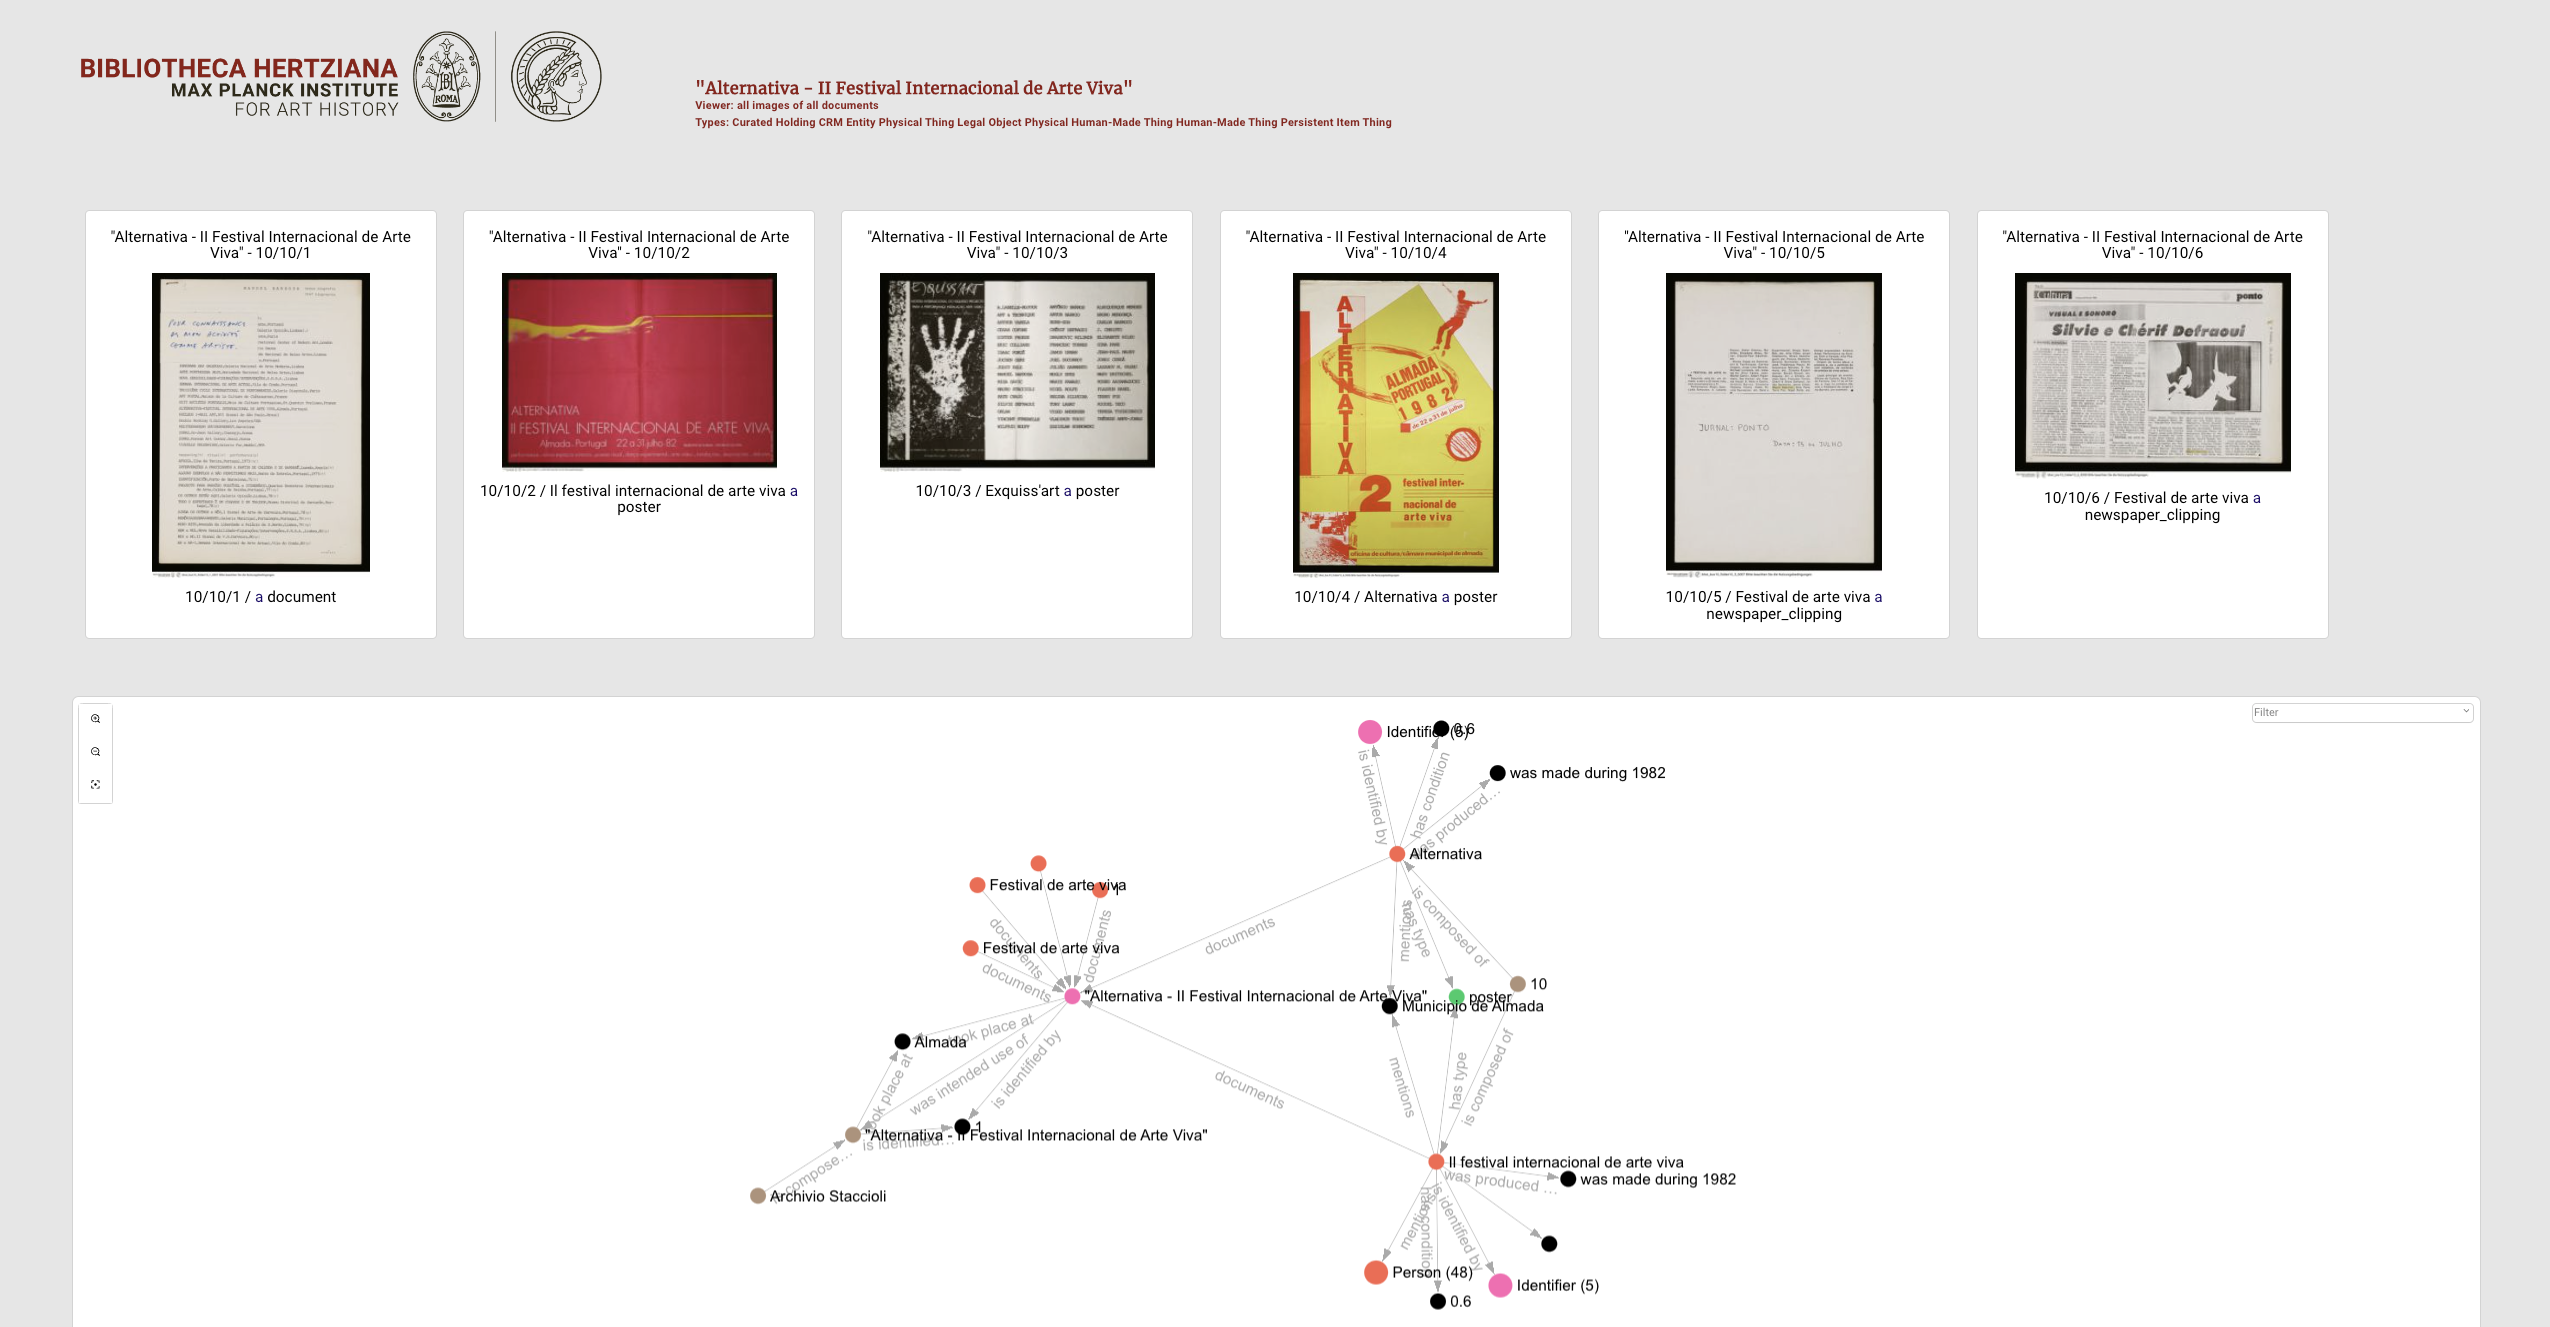
Research and inventory data based on CIDOC CRM and the digitised artefacts with IIIF manifests have been integrated into a knowledge graph. This is an important prerequisite for offering researchers a variety of search functions that allow them to explore the contents of the archive from different perspectives. The collection holdings can be searched and displayed by specific entities such as project, person, location, artwork or archived unit.
The digital archive provides a variety of ways to discover Staccioli's estate. Different visualisations, such as the geographical localisation of the artefacts on a map or their temporal placement on a timeline, make it possible to investigate new contexts.
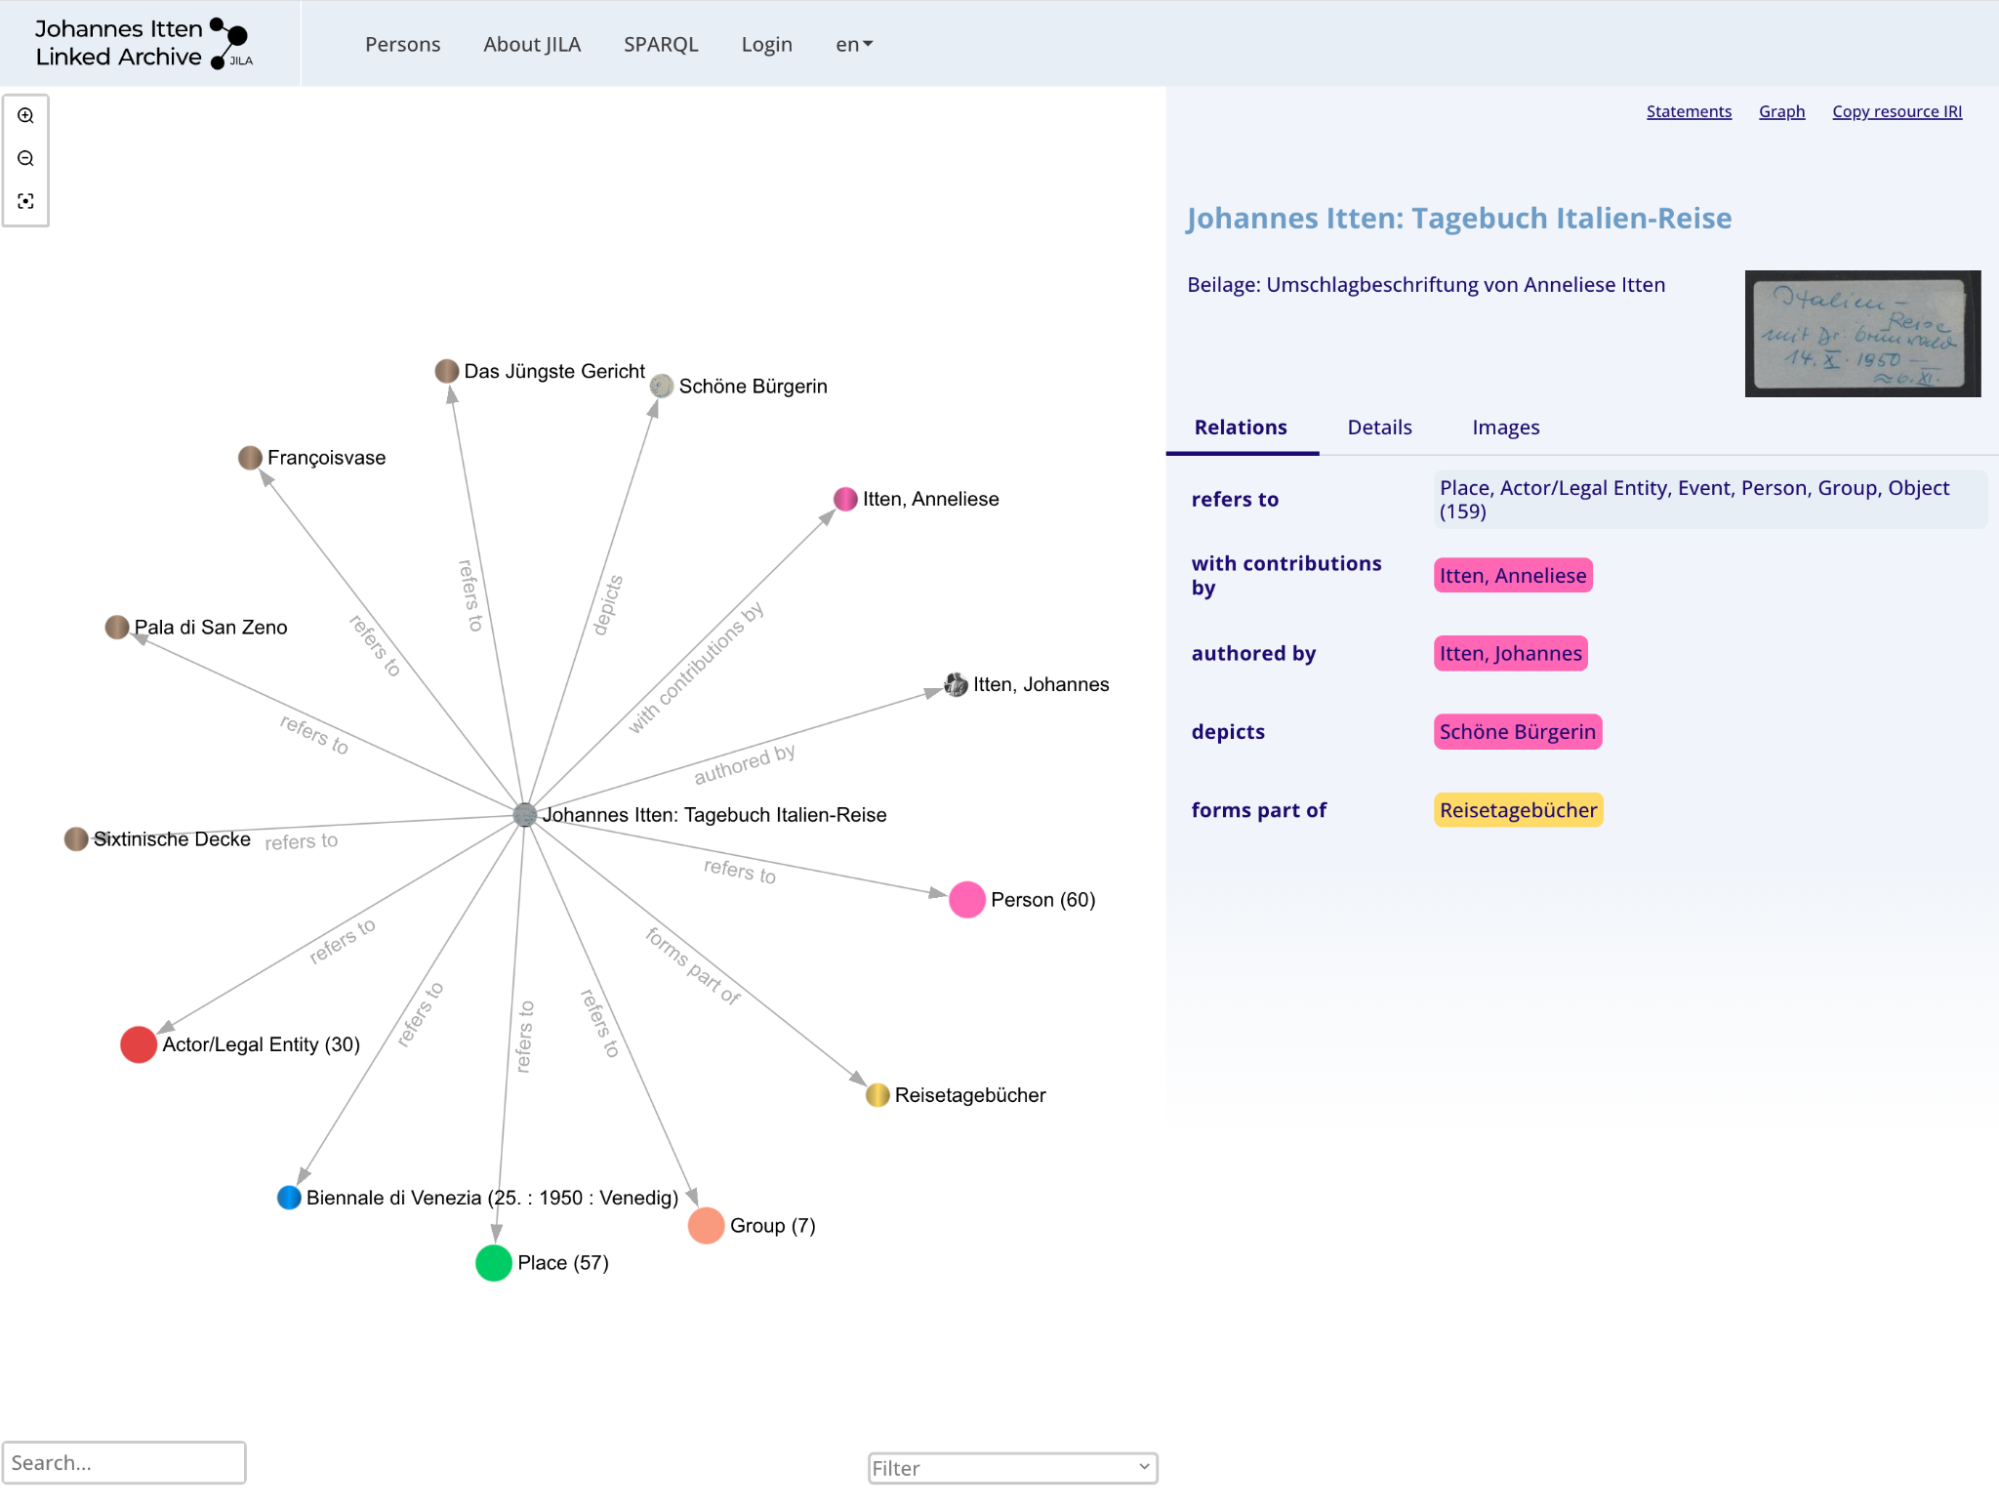
Furthermore, the artefacts are visualised in an interactive, semantic network using a Sigma graph component developed by SARI. Users can navigate freely through the network. The application allows to trace and analyse relations between a variety of entities such as people, places, objects and their networks. In this way, complex relations in Staccioli's estate can be easily visualised and explored according to specific research interests.