Visualising Networks. The Sigma Graph Component
We developed a novel ResearchSpace component to seamlessly explore and visualise networks of any shape and size. The need for such a visualisation component arose within the project Johannes Itten Linked Archive (JILA) that we realised in collaboration with the Zentralbibliothek Zürich. JILA makes the archive of letters, documents, photographs and other personal sources of Johannes Itten available as linked open data.
The project puts a particular emphasis on the individuals who appear in those documents, capturing both known and unknown persons, and their relations to the documented items and each other. In order to allow researchers to explore these relationships, JILA required a suitable way of making these social networks visually accessible.

-
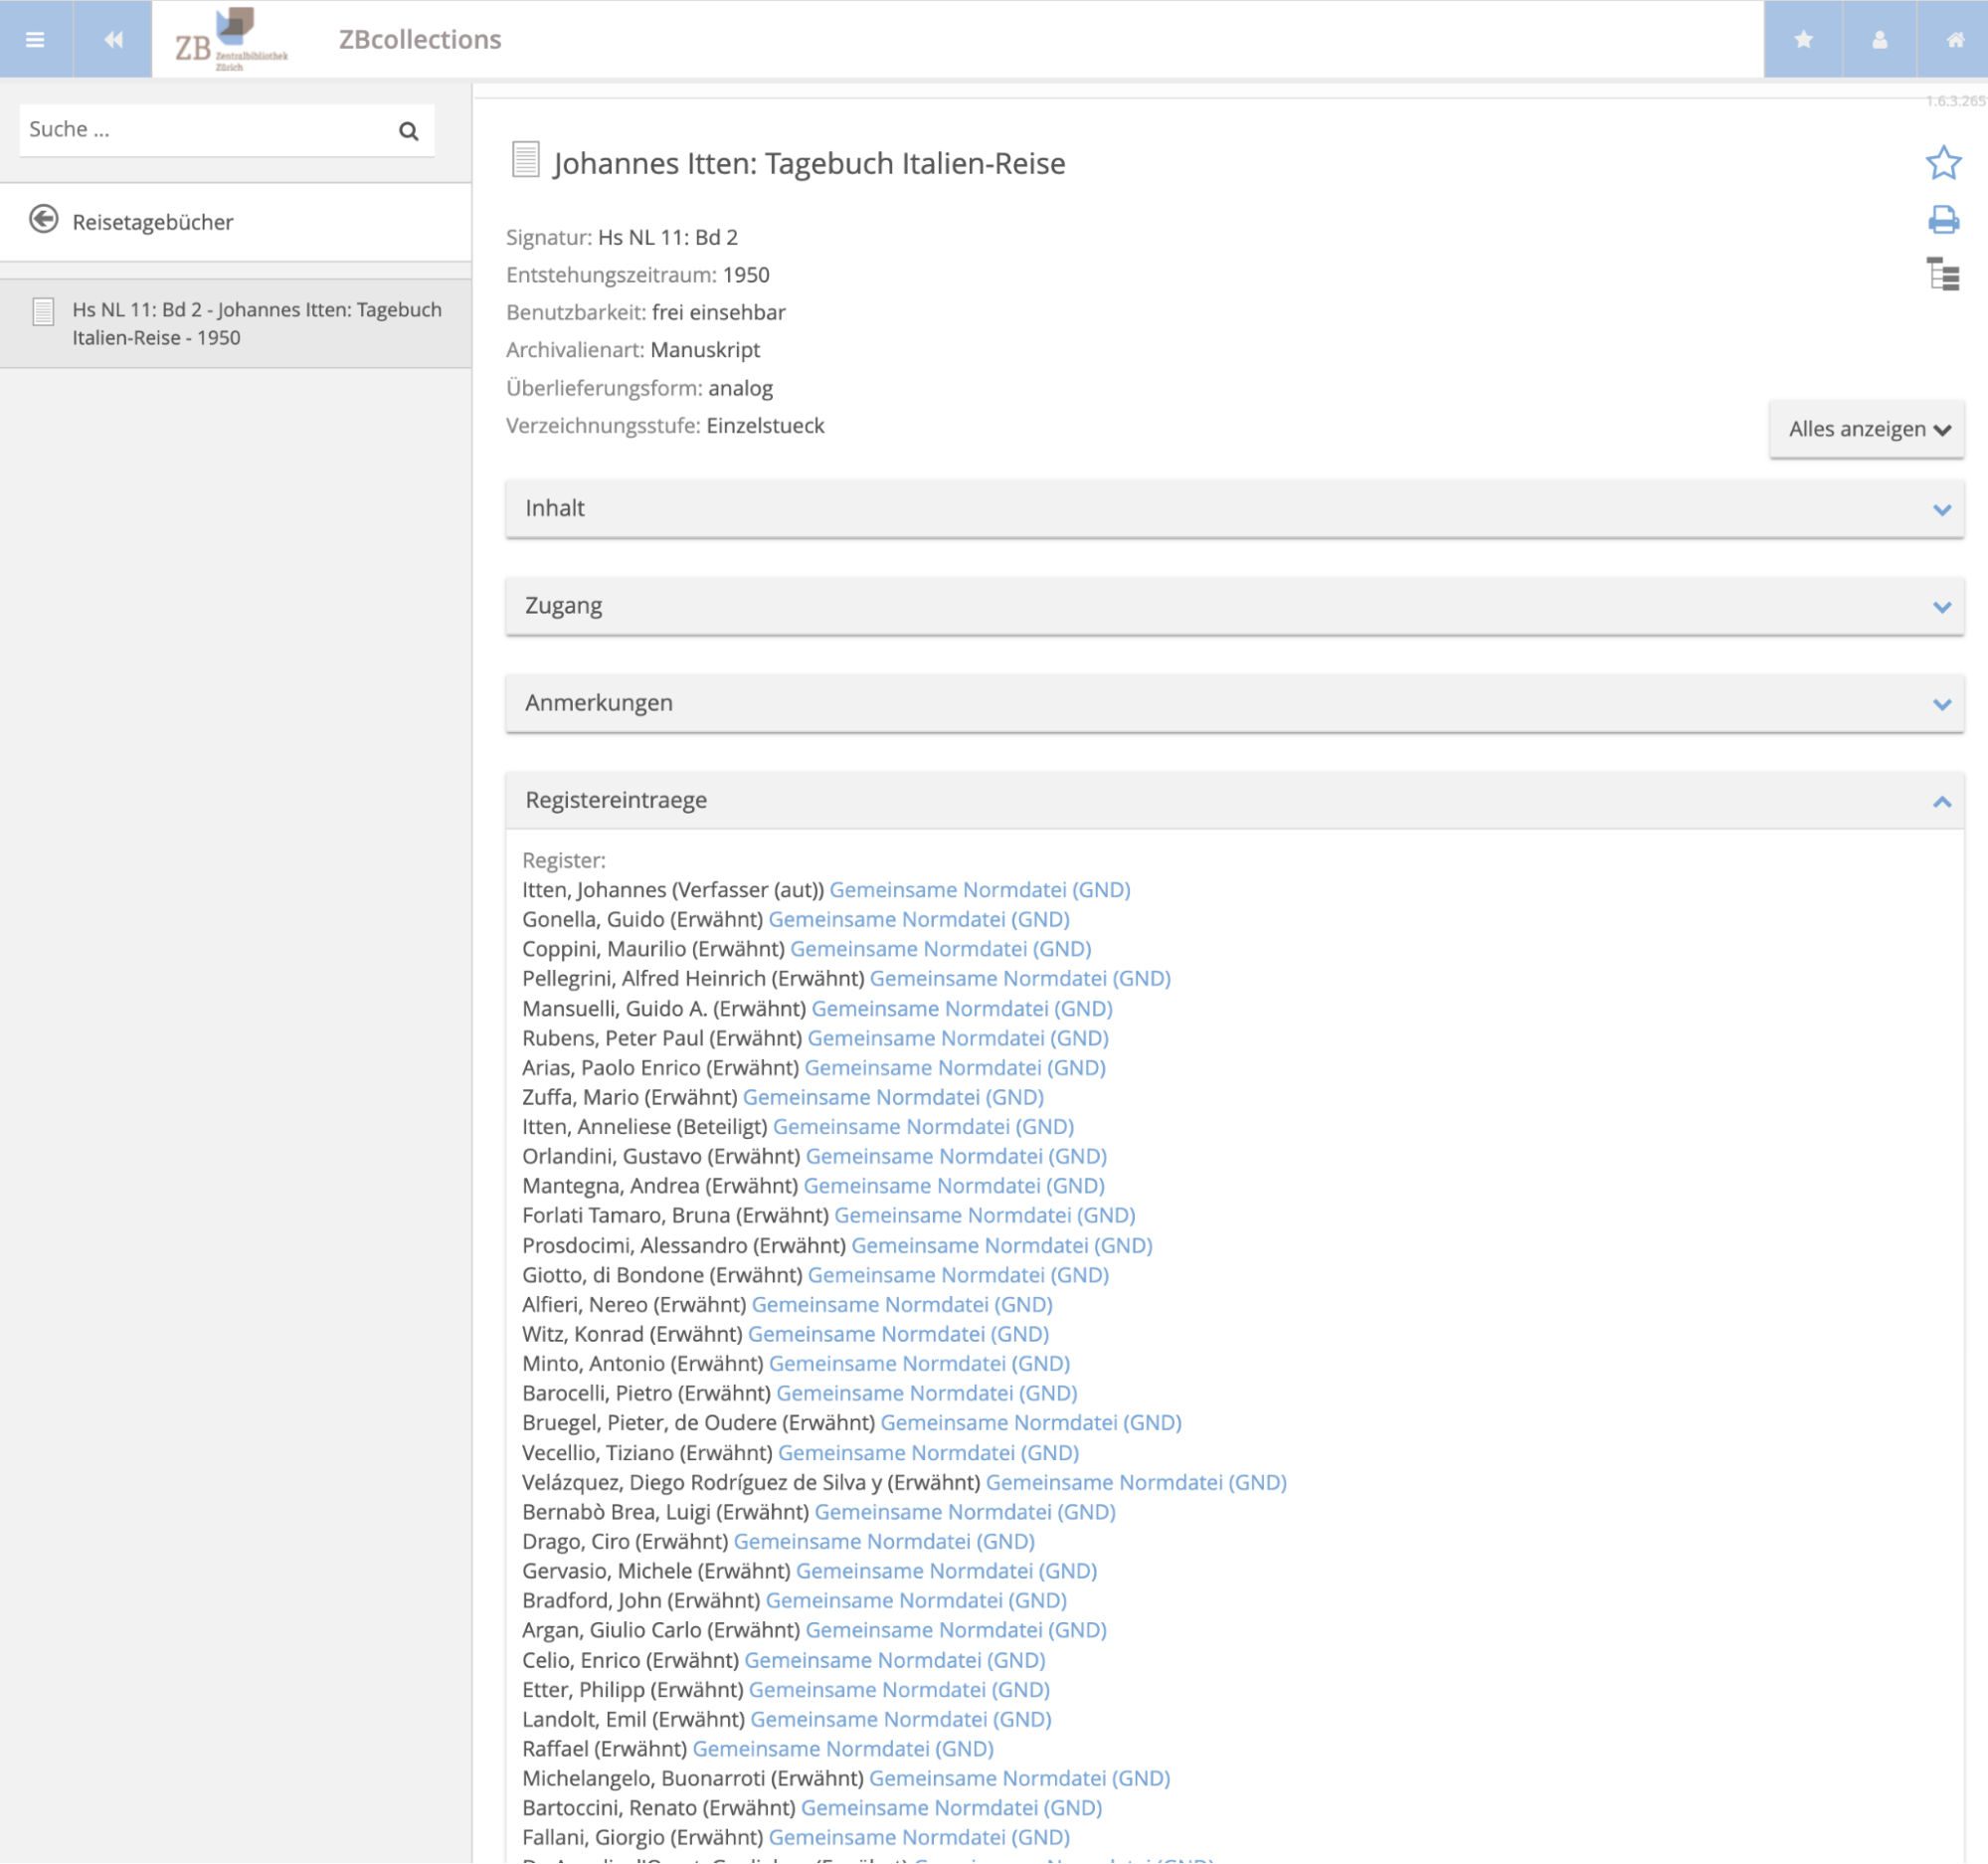
Fig. 1: An entry for Johannes Itten’s travel diary in the collections of the Zentralbibliothek. Numerous people, places and institutions that are mentioned are listed. (Source: SARI, CC-BY 4.0)
Visualising networks poses a number of challenges, many of which we immediately encountered in JILA. Networks can vary immensely in scale, from containing only a few nodes and edges to thousands of relationships. In JILA we have many nodes that are related to prominent persons, such as Walter Gropius, Anna Höllering, or of course, Johannes Itten himself. Lesser known or unknown persons, on the other hand, may have only few connections. A network visualisation tool needs to effectively deal with both scenarios, arranging nodes in a meaningful way. If the visualisation is interactive, it needs to remain usable and performant as the network grows in size. Moreover, interactivity itself presents a challenge for network visualisations. Navigating a network is not trivial, especially if we aim to give users as much control over the visualisation as possible.
Visualising networks becomes even more complex when dealing with different types of nodes and edges. At JILA, for instance, we encountered the challenge of representing diverse entities such as persons, groups, documents, places, and works within the network. Furthermore, there are various types of relationships between these entities, such as documents that mention or represent specific individuals or groups, or diverse familial connections between individuals.

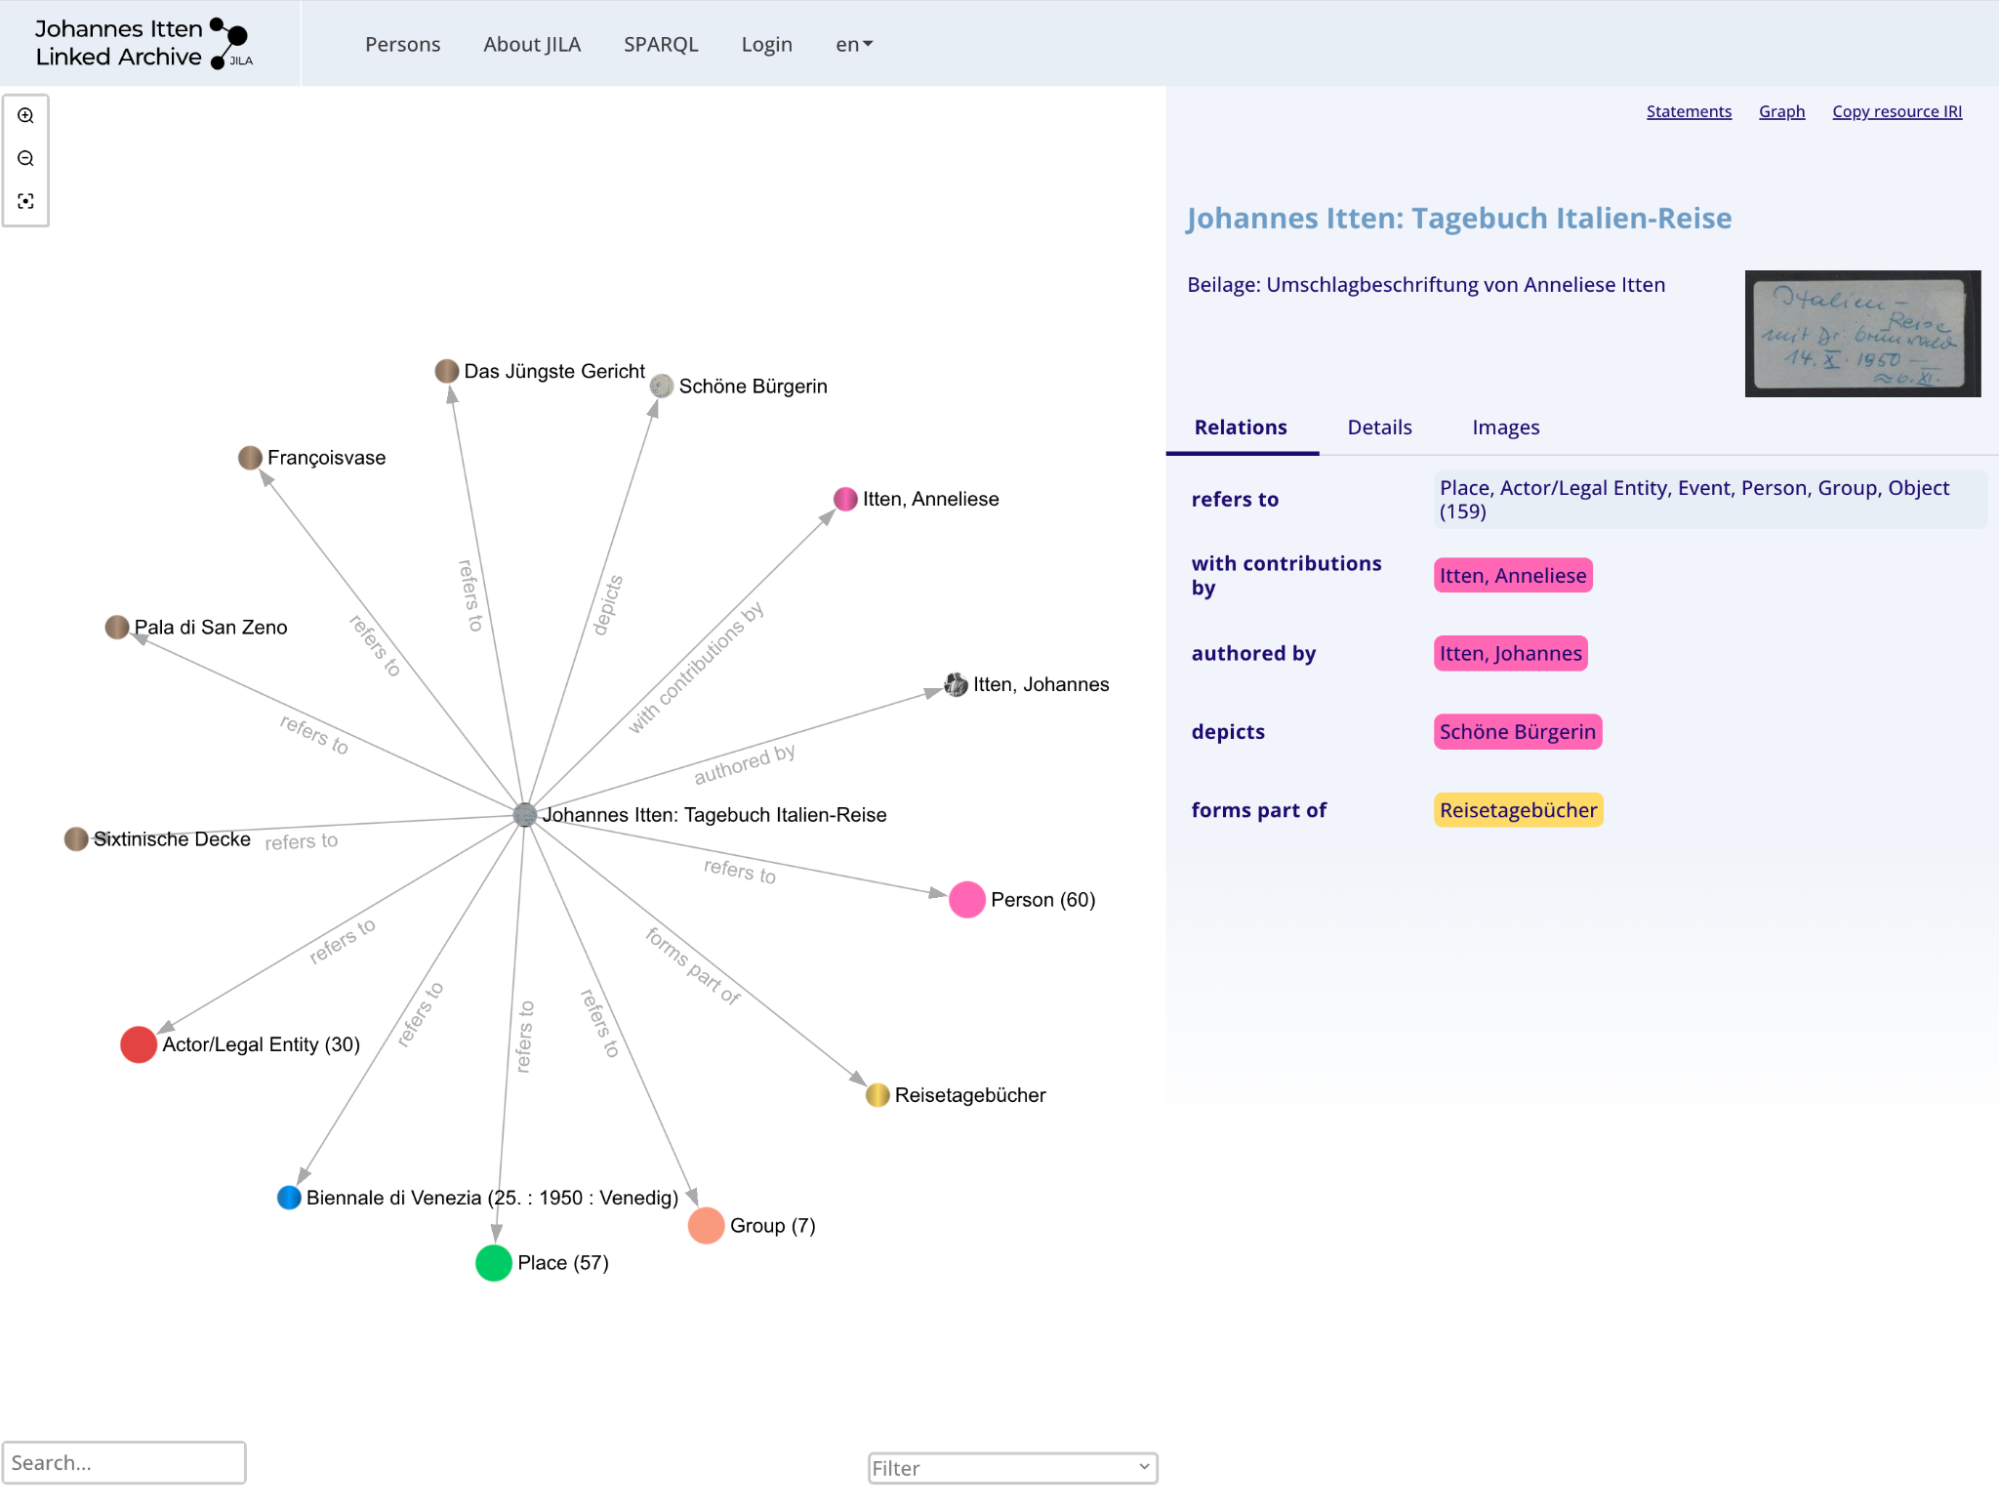
- Fig. 2: The same catalogue entry of Johannes Itten’s travel diary visualised in JILA. The entities that are mentioned are grouped by type and can be explored individually. (Source: SARI, CC-BY 4.0)
ResearchSpace already offers two components for visualising and exploring networks. The Semantic Graph component is based on Cytoscape.js, a JavaScript library for network visualisation and analysis. In the implementation in ResearchSpace it comes equipped with a number of different network layouts as well as ways of navigating the network through zooming and panning. A network can be constructed directly from a SPARQL query on the triple store. Where it fell short for our purposes are the limited interactivity – a network must remain largely static and cannot grow in size – and limited performance when visualising large networks – usability decreases significantly with only a few hundred nodes.
The second network component is based on Ontodia. This component allows users to explore and expand a (linked data) network step by step. It enables a detailed view of rich semantic data, however just like the Cytoscape component, it does not scale well to large networks and can quickly become cluttered.
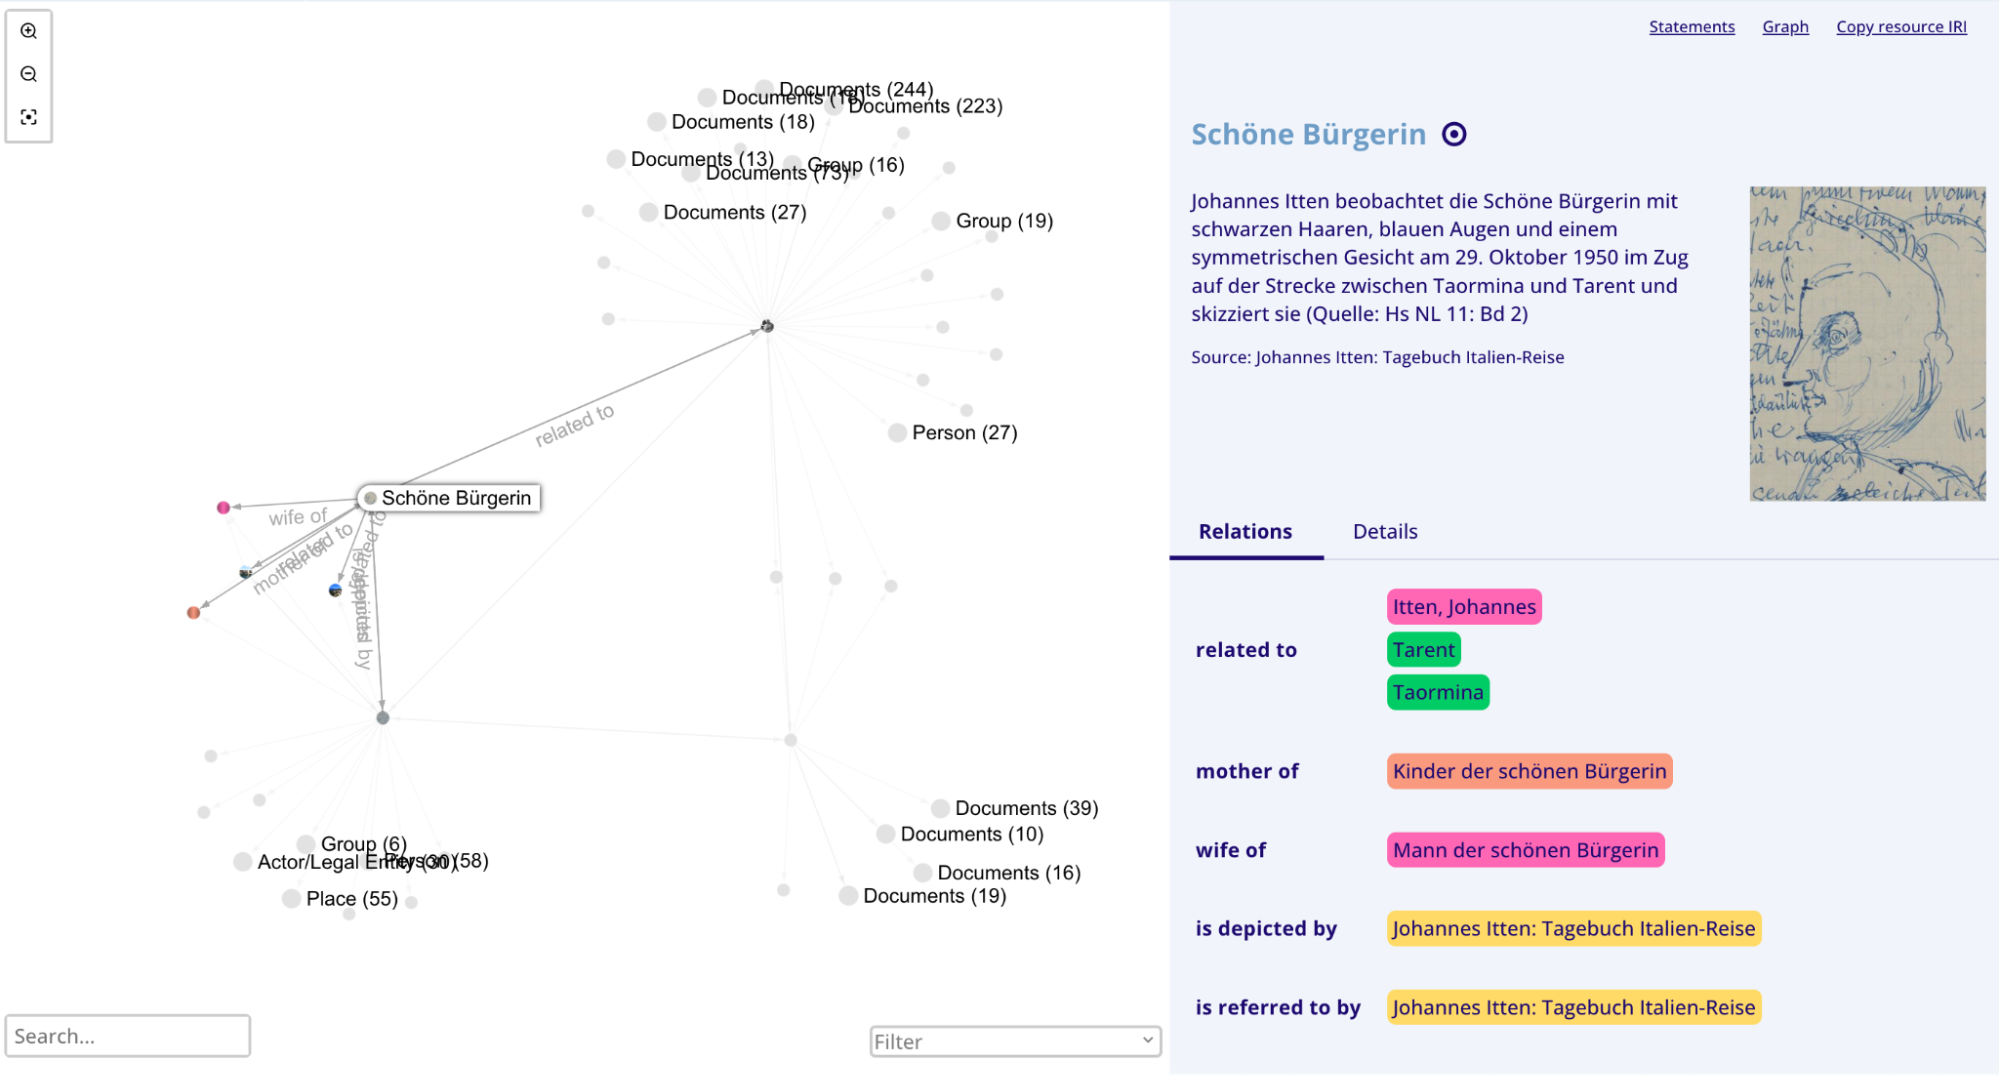
We therefore developed a new network visualisation component that is based on the JavaScript library Sigma.js. Sigma.js has the advantage over the aforementioned libraries that it uses the GPU to visualise network and therefore is able to visualise also very large networks. In order to allow users to make sense of network data, we implemented a number of features that enable users to explore it without being overwhelmed by the size of a network. Nodes are grouped by type as well as the connection to other nodes. In JILA, even the network around Johannes Itten, the largest ego-network in the collection, can be visualised and explored with ease. Additional data for nodes can be added on-demand and the network explored step by step.
The network component is integrated with ResearchSpace's Event System and can therefore be controlled and synchronised with other content on the app. In JILA we utilise this mechanism in order to allow users to navigate and expand the network both through the visualisation as well as through the details panel on the right-hand side of the screen. Through the tight integration with ResearchSpace and by following conventions set out in its existing network component, our network visualisation is fully reusable and extensible to other projects built on ResearchSpace.

-
Fig. 3: Users can expand the network at will. Relationships of individual entities can be highlighted and the dynamic grouping of nodes ensures that the network remains readable at scale. (Source: SARI, CC-BY 4.0)
Author: Florian Kräutli